Data Visualisation
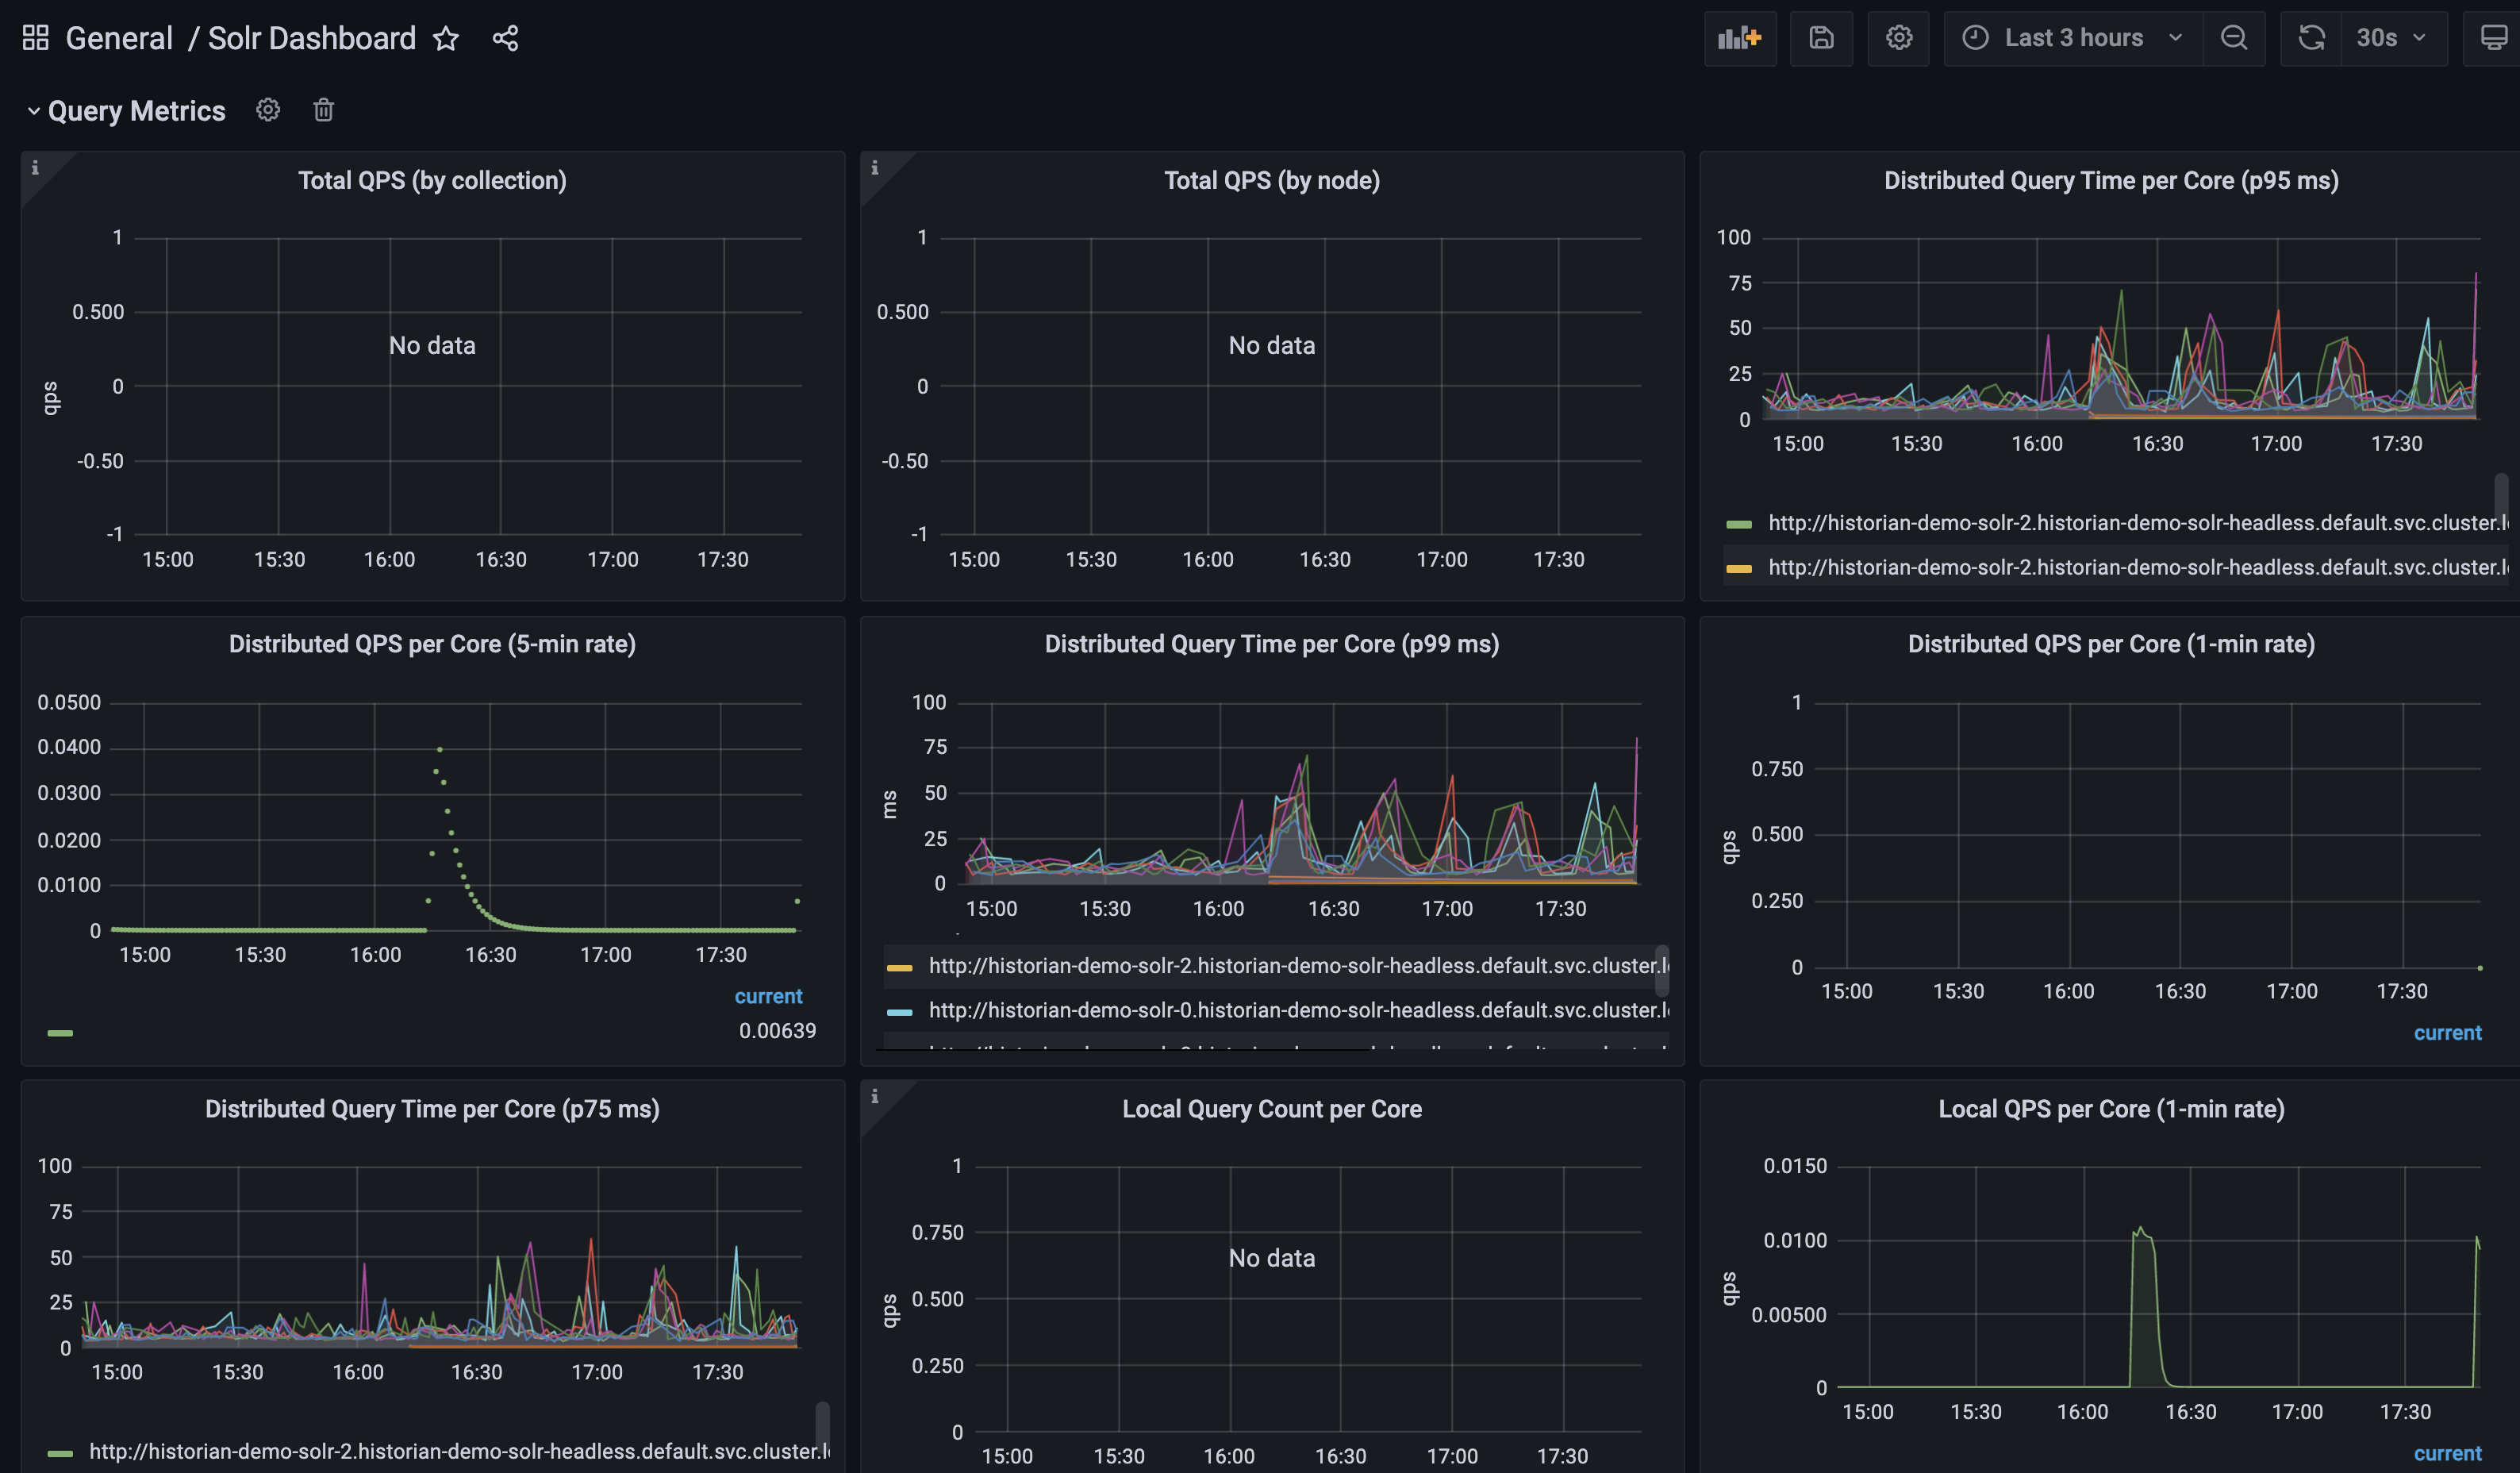
Solr Monitoring
Here is an example dashboard of Historian monitoring its own SolR backend
Data mining
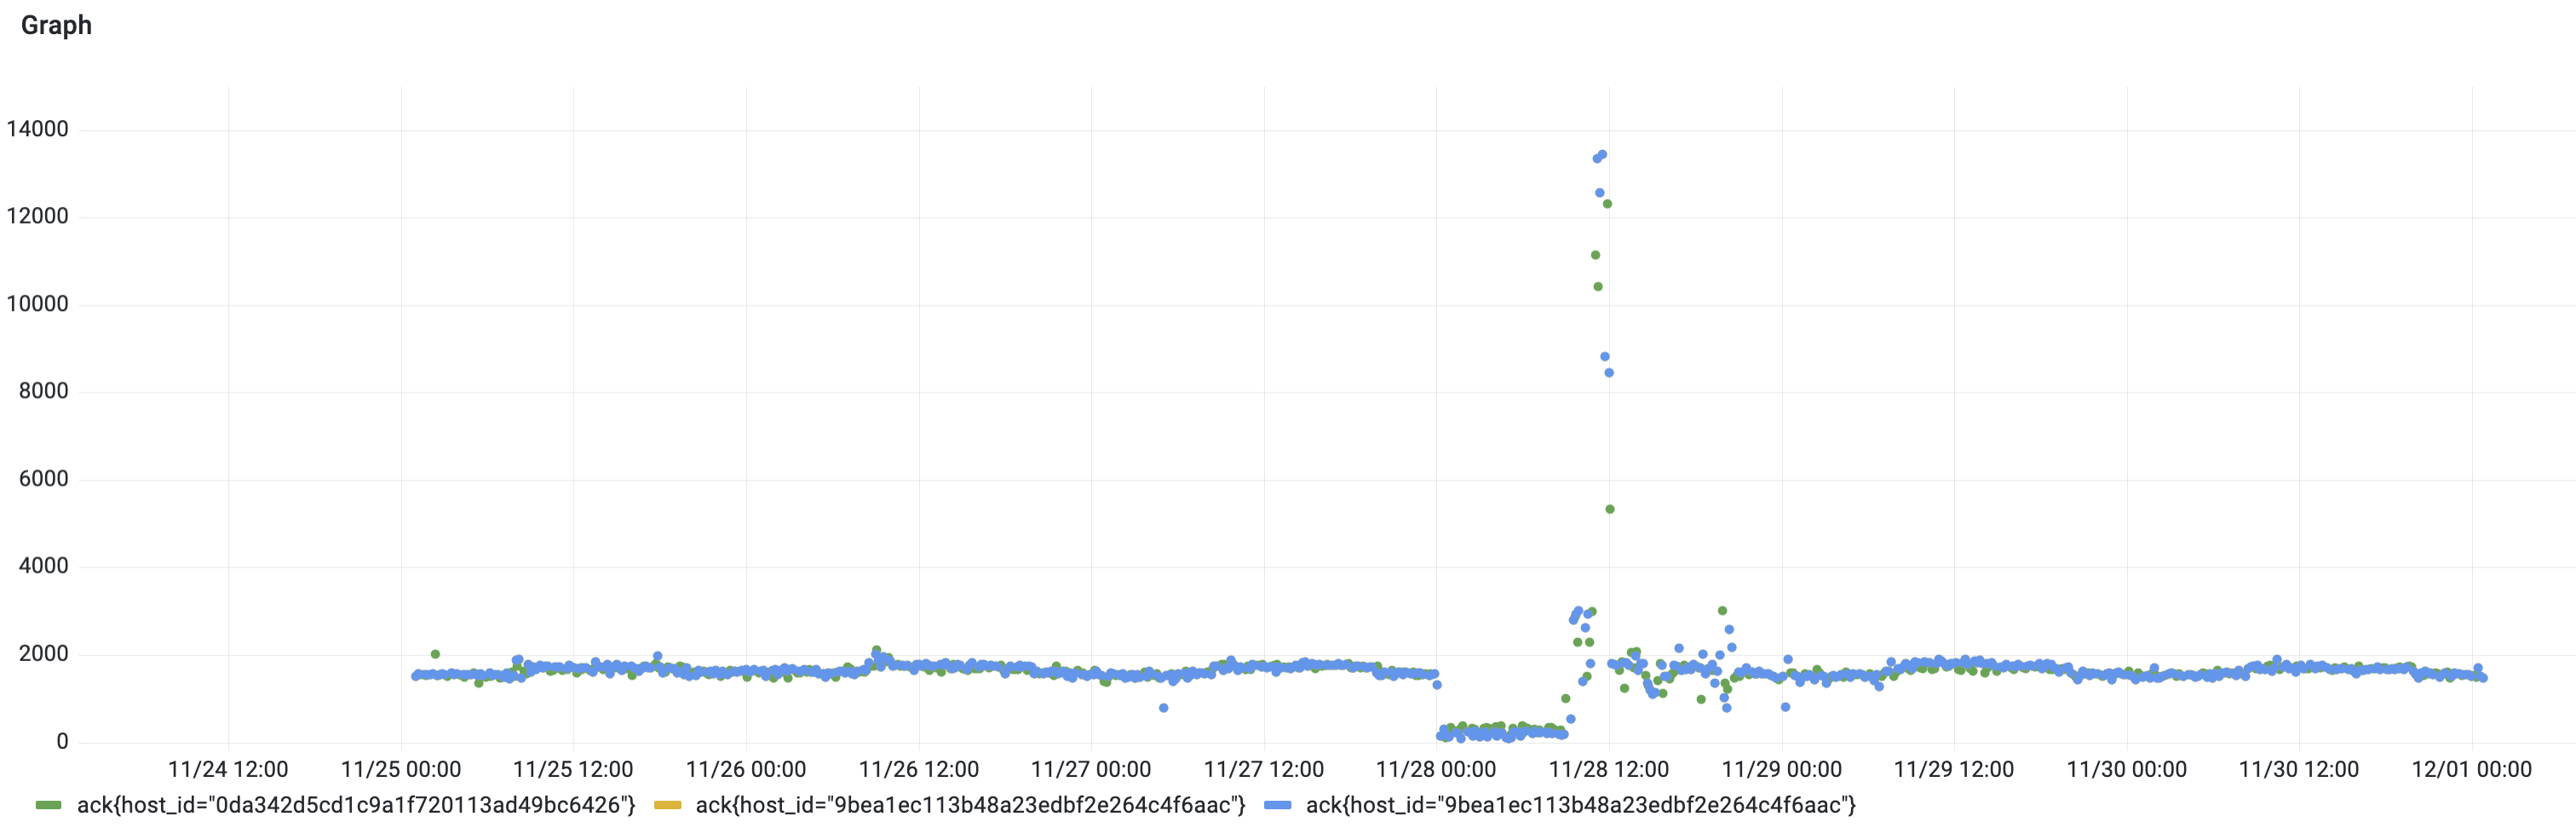
Back to the clustering tutorial, remember that we’ve found something strange happening on day 2019-11-28 on ack for host_id=51c390afac2f78e0d48c370a991bb94e, 0da342d5cd1c9a1f720113ad49bc6426, 9bea1ec113b48a23edbf2e264c4f6aac
Let’s first graph all ack measures in the correct date range (remember we’re not in 2019 anymore)
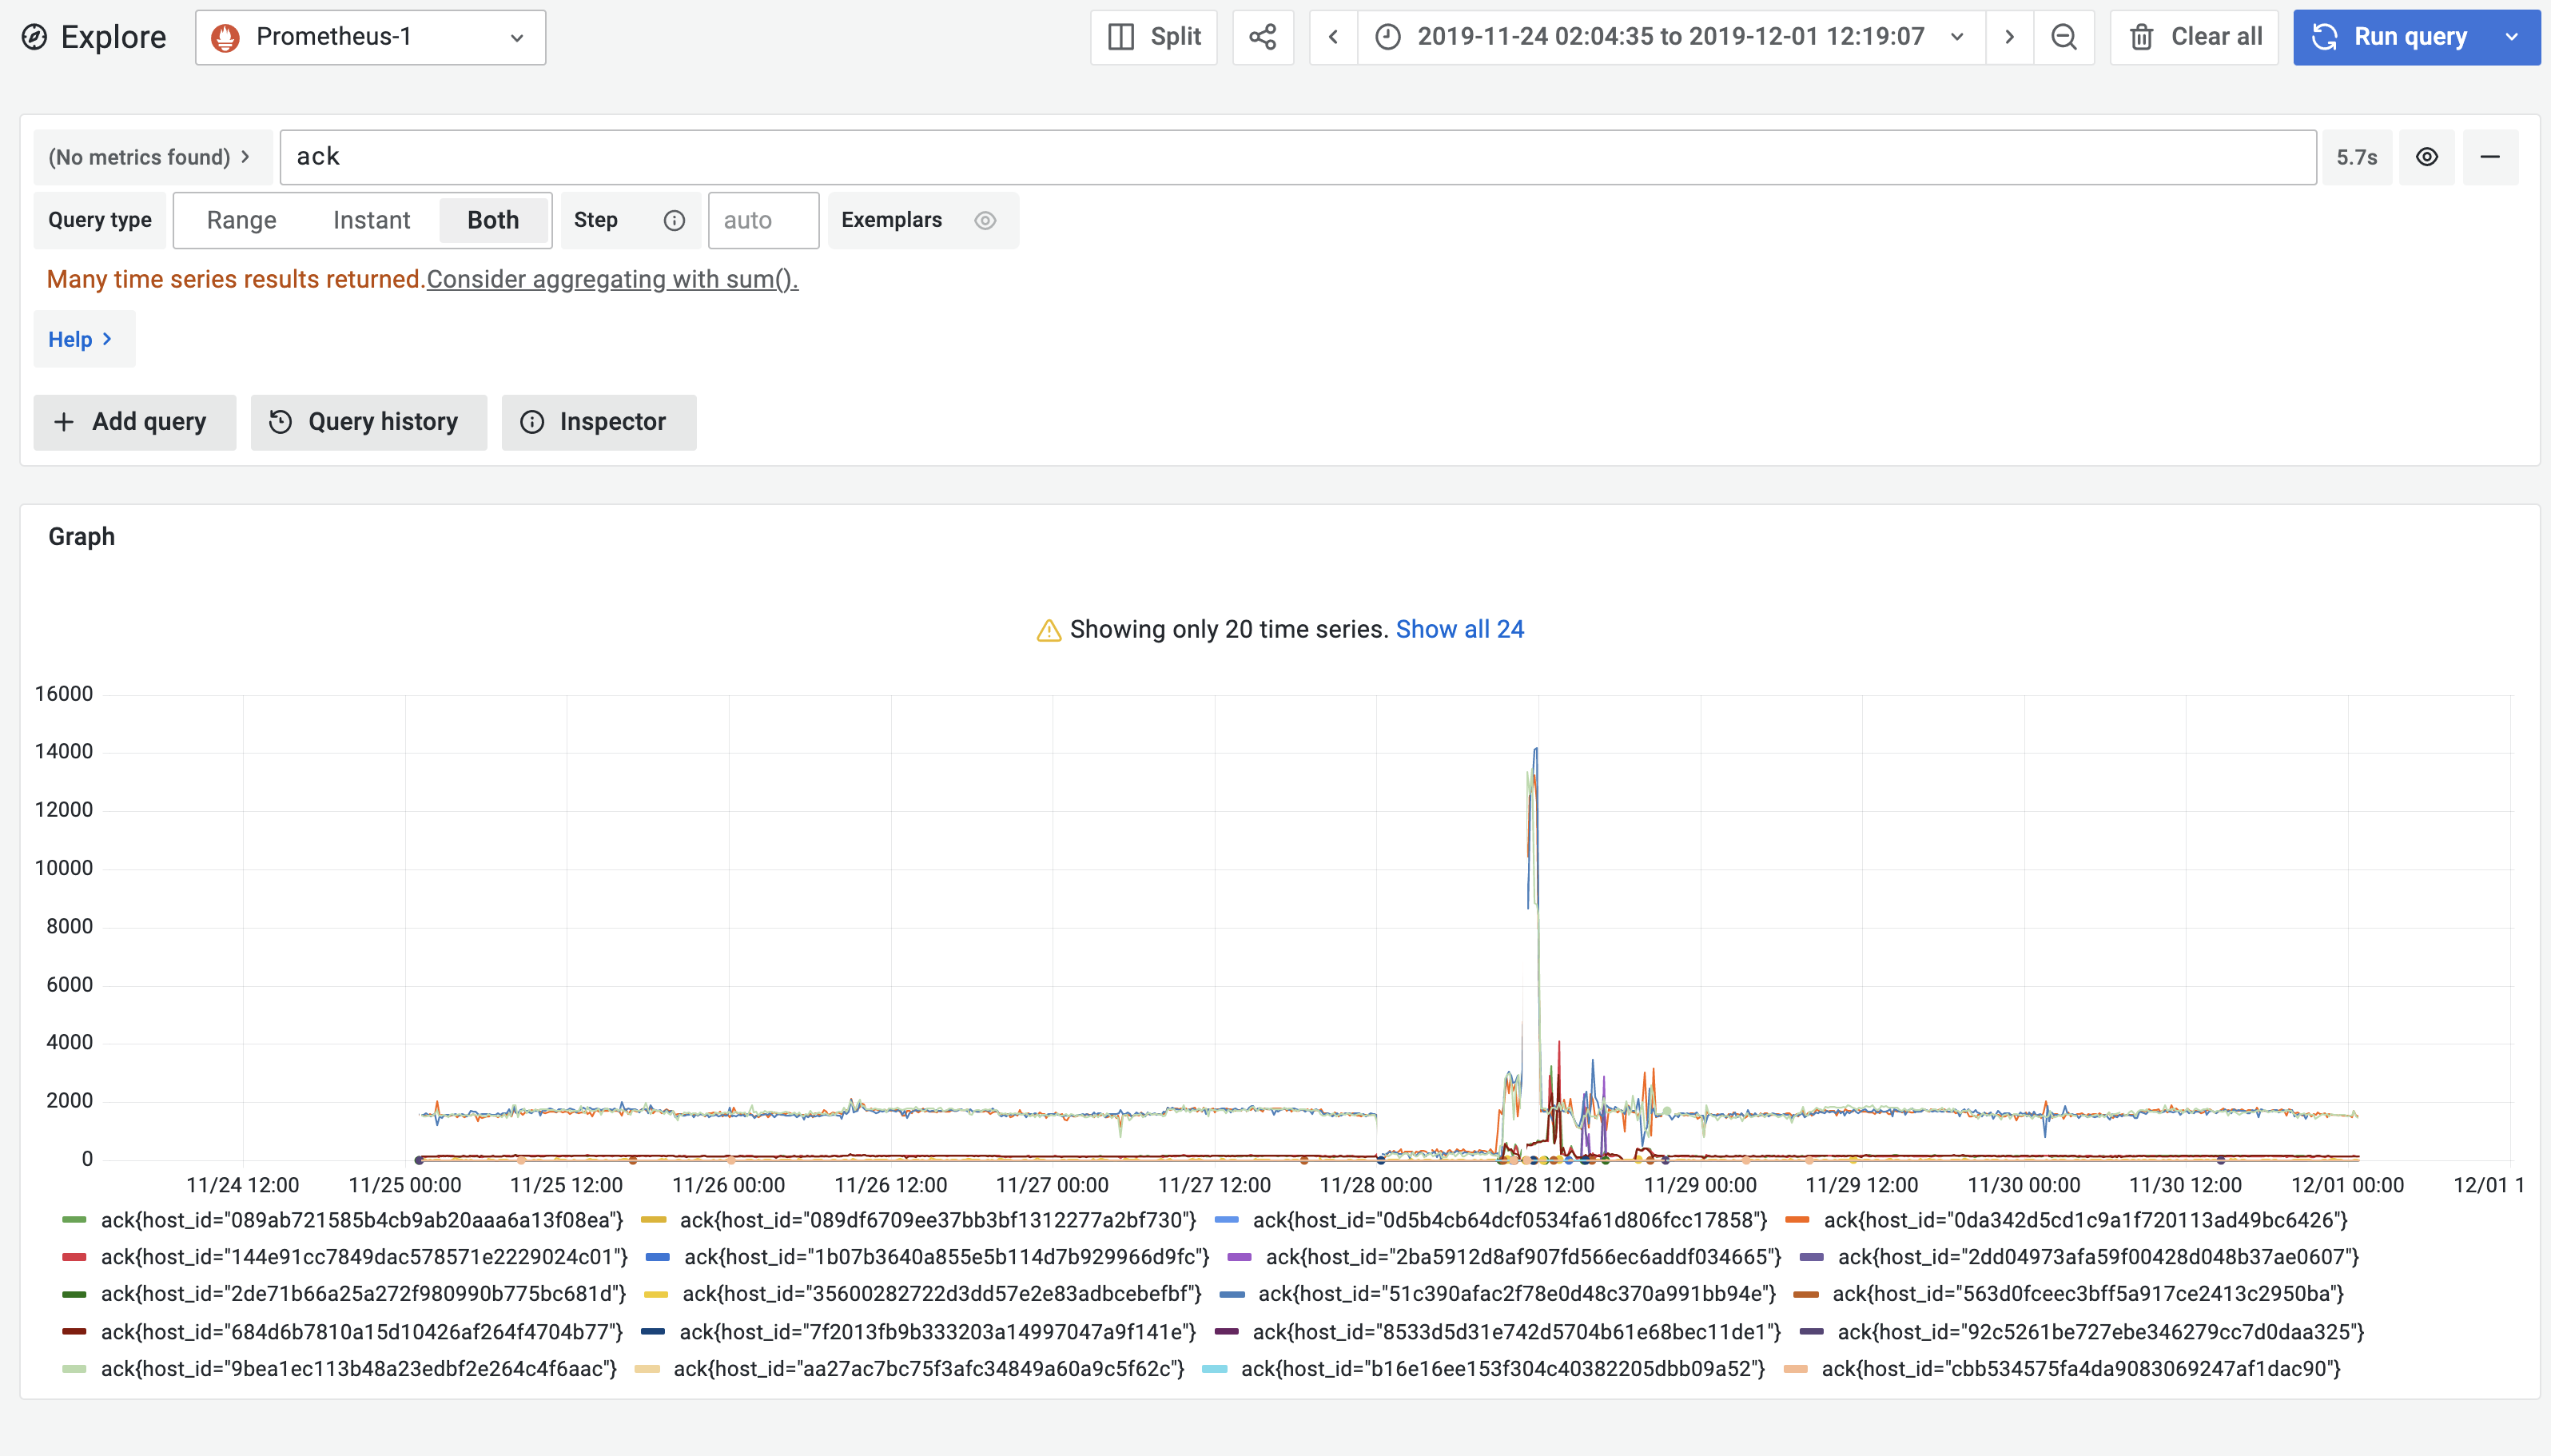
and then drill down to those clustered host_id. something funny isn’t it. This high peak of acknowledgement requests !!